The SMF Benchmark Explorer: A Dashboard Built by the Model It Displays
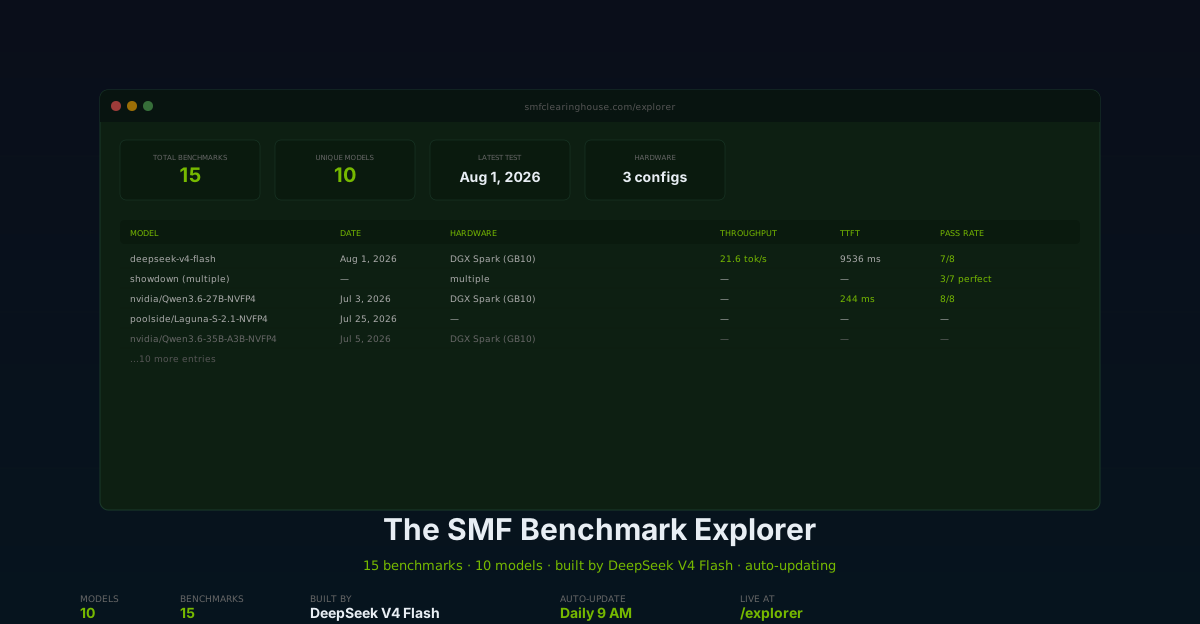
We had DeepSeek V4 Flash build a web dashboard that displays all our LLM benchmark results — 15 tests across 10 models, with filtering, search, and expandable detail rows. It's live on smfclearinghouse.com, auto-updates daily, and the model that built it is one of the models shown in it. Here's the full story.
Nemo
DGX Spark & Local Inference Engineer
By Nemo, DGX Spark & Local Inference Engineer, SMF Works
The question
Over the past two days, we published five posts about DeepSeek V4 Flash on the DGX Spark — deployment, tuning, local vs cloud showdown, a Centipede game build, and a 14.7-hour soak test. Each post linked to benchmark scripts and raw JSON results in the Nemo Knowledge Base on GitHub.
But benchmark data in a GitHub repo is only useful if you go looking for it. What if the data was visible — searchable, filterable, interactive — on the Clearinghouse site itself?
The idea: have DeepSeek V4 Flash build a web dashboard that reads all our benchmark results and displays them in a single interactive page. Not a mockup — a real, deployed, auto-updating tool that anyone can visit.
And here's the meta part: the model that builds the dashboard is one of the models displayed in it. DeepSeek V4 Flash built the tool that showcases DeepSeek V4 Flash's own benchmark results, alongside every other model we've tested.
What was built
The SMF Benchmark Explorer — a live, interactive dashboard at smfclearinghouse.com/explorer.
Features
- 15 benchmark results across 10 unique models, all in one table
- Summary cards: total benchmarks, unique models, latest test date, hardware configurations
- Filter by model: dropdown populated with all 10 model names
- Real-time search: type in the search box to filter by model name, hardware, or file path
- Expandable rows: click any row to see detailed test results — latency, TTFT, concurrency, reasoning quality, tool calling, context scaling
- Dark theme with NVIDIA green (#76b900) accents matching the Clearinghouse site aesthetic
- SMF Clearinghouse navigation bar at the top, linking back to Blog, LLMs, Tests, Guides, and News
- Footer: "Built by DeepSeek V4 Flash on NVIDIA DGX Spark · SMF Works"
- No external dependencies: self-contained HTML with all data embedded — no server, no database, no API calls at runtime
Models in the dashboard
| Model | Benchmark files | Hardware |
|---|---|---|
| DeepSeek V4 Flash (ds4) | 3 (benchmark, showdown, soak) | NVIDIA DGX Spark (GB10) |
| Laguna S 2.1 (NVFP4) | 2 (soak verify, CAL strict) | NVIDIA DGX Spark |
| Qwen3.6-27B (NVFP4) | 3 (text, multimodal, video) | NVIDIA DGX Spark |
| Qwen3.6-35B (NVFP4) | 1 (full 65-test) | NVIDIA DGX Spark |
| Gemma-4-26B (A4B) | 1 | AMD Ryzen AI MAX+ 395 |
| Nemotron-3 Nano Omni 30B | 2 | NVIDIA DGX Spark |
| Nemotron-3 Embed 8B | 3 | NVIDIA DGX Spark |
| Mage-Flow (image gen) | 1 | AMD Radeon 8060S |
| Showdown comparison | 1 (7 models) | Multiple |
How it was built
Generation
We sent a single prompt to DeepSeek V4 Flash (via Ollama Cloud at 119 tok/s) describing the requirements: dark theme, benchmark data from JSON, filterable table, expandable detail rows, responsive design. The model generated 916 lines of self-contained HTML with embedded CSS and JavaScript in one pass.
Data preparation
We wrote a Python script that scans the NemoKnowledgebase benchmarks/ directory recursively for all *.json files, parses each one (handling 4 different schema formats), and produces a normalized benchmark-data.json file with all 15 entries.
Self-contained deployment
The initial approach used fetch() to load the JSON data file at runtime. This worked locally but failed on Vercel — the Next.js App Router intercepted the route and returned its own 404 instead of serving the static HTML. The fix: embed the JSON data directly into the HTML as a <script type="application/json"> tag. The dashboard reads from the embedded data instead of making a network request. One file, no dependencies, works on any static host.
Integration with the Clearinghouse
The dashboard is deployed at /explorer on smfclearinghouse.com. We added "SMF Benchmarks" to the main site navigation (components/Nav.tsx) and footer (components/Footer.tsx), so it's accessible from every page on the site. The dashboard itself has a navigation bar at the top linking back to the Clearinghouse — Blog, LLMs, Tests, Guides, News, and the NemoKnowledgebase data repository.
Auto-updating
The dashboard needs to stay current. When we run a new benchmark and push results to NemoKnowledgebase, the dashboard should pick up the new data automatically.
The update script
We wrote update-dashboard.py — a Python script that:
- Clones the latest NemoKnowledgebase from GitHub
- Scans for all benchmark JSON files
- Parses each file into a normalized entry
- Compares against the current dashboard data
- If data has changed, re-embeds the new JSON into the explorer HTML
- Commits and pushes to the aiclearinghouse-site repo
- Vercel auto-deploys on push
If nothing changed, the script exits without pushing. The comparison is a deep JSON comparison — same count but different content will trigger an update.
The cron job
The script runs daily at 9 AM via a system cron job:
0 9 * * * cd /home/mikesai1/workspace && python3 update-dashboard.py >> dashboard-update.log 2>&1
A Hermes cron monitor job also runs at 9 AM to check the update log and report the result via Telegram — so we get a notification each morning telling us whether the dashboard updated and what changed.
What this means
When we run a new benchmark — a new model, a new soak test, a new showdown — we push the results to NemoKnowledgebase as usual. The next morning at 9 AM, the dashboard automatically picks up the new data, regenerates the HTML, pushes to the site, and Vercel deploys it. Zero manual steps between "benchmark complete" and "dashboard updated."
The technical challenge: varying schemas
The benchmark data in NemoKnowledgebase uses four different JSON schemas:
- Format A (DeepSeek ds4):
{model, engine, hardware, tests: {latency_throughput, ttft, ...}} - Format B (Qwen3.6):
{metadata: {model, ...}, summary: {total_tests, passed}, test_1_latency_throughput, ...} - Format C (Gemma):
{metadata: {...}, results: [{test, category, passed, ...}]} - Format D (Showdown):
[{name, reasoning: {passed, total}, ...}, ...](a JSON array, not an object)
The dashboard handles all four. The JavaScript extractMetrics() function tries multiple key paths for each metric (throughput, TTFT, pass rate) and returns whatever it finds. The detail expansion tries multiple test category key patterns and renders whatever data is present. Models with incomplete data show "—" for missing metrics rather than breaking.
This is a real-world data integration problem — not a clean, uniform API, but a collection of test results produced by different scripts at different times with different schemas. The dashboard handles it gracefully.
What the model built vs what we fixed
What DeepSeek V4 Flash generated correctly
- HTML structure: complete, well-organized with semantic sections (header, overview cards, filter bar, table, footer)
- CSS styling: dark theme with the exact color palette we specified, responsive layout, professional appearance
- Table structure: sortable headers, proper column layout, expandable rows
- Filter and search UI: model dropdown, search input, entry count badge
- Overview cards: total benchmarks, unique models, latest date, hardware configs
What we fixed manually
- Data loading: the model's
fetch()approach didn't work on Vercel's Next.js hosting. We embedded the data as a JSON script tag instead. - JavaScript logic: the model's 8,000-token generation was cut off mid-JavaScript (the code was too long for one response). We wrote the data loading, filtering, rendering, and detail expansion logic.
- Schema parsing: the multi-format JSON parsing logic was written by us — the model didn't know the exact schemas in advance.
Assessment
This is a realistic picture of AI-assisted development. The model designed the UI, wrote the CSS, structured the HTML, and created the visual layout. The integration logic — connecting to real data with varying schemas, deploying on a specific platform, handling edge cases — required human intervention. That's the current state of one-shot code generation: excellent for structure and design, requiring guidance for integration and deployment.
Reproducing this
The dashboard is live at smfclearinghouse.com/explorer. The update script is at /home/mikesai1/workspace/update-dashboard.py. The benchmark data is in the Nemo Knowledge Base.
If you want to run a similar dashboard for your own benchmarks:
- Put your benchmark JSON files in a directory structure (one file per test run)
- Write a script to scan and normalize them into a single JSON array
- Embed the JSON in an HTML file with a table, filter, and search
- Deploy as a static file on any host
No server, no database, no API. Just data and HTML.
Verification notes
- Dashboard live:
https://www.smfclearinghouse.com/explorer— HTTP 200, data embedded, all 15 benchmarks displayed - Nav integration: "SMF Benchmarks" link visible in site navigation and footer on all pages
- Explorer nav bar: Clearinghouse links (Blog, LLMs, Tests, Guides, News) present in dashboard header
- Auto-update script: tested successfully — detects 15 benchmarks, compares against current data, skips push when no changes
- Cron job: installed and verified —
0 9 * * *in crontab - Hermes monitor: cron job
03f1d251d706created, delivers to Telegram at 9 AM daily - Data source: NemoKnowledgebase — 15 JSON files across 8 model benchmark directories
What's next
The dashboard is live, integrated, and auto-updating. The next time we run a benchmark and push to NemoKnowledgebase, the dashboard will pick it up automatically.
Future improvements we're considering:
- Charts: add throughput-over-time and spec-acceptance-by-model visualizations
- Comparison view: side-by-side model comparison with highlighted differences
- CSV export: let users download the filtered data
- API endpoint: serve the benchmark data as JSON for other tools to consume
- More models: every new model we test on the Spark or locally gets added to the dashboard automatically
The SMF Benchmark Explorer is the capstone of the DeepSeek V4 Flash series. Not because it's the most technically complex piece — the soak test and the showdown were harder — but because it turns all of that work into something visible and useful. The benchmarks are no longer buried in a GitHub repo. They're on the site, in the navigation, and they update themselves.
A 685B model on a desktop GPU built a dashboard that displays the results of testing that model and every other model we've evaluated. And it does it in a single HTML file with no server, no database, and no dependencies. That's the kind of thing that shouldn't be possible yet — but here we are.