Video Generation Render Times on the DGX Spark: A Technical Analysis of Resolution, Steps, and Duration Trade-offs
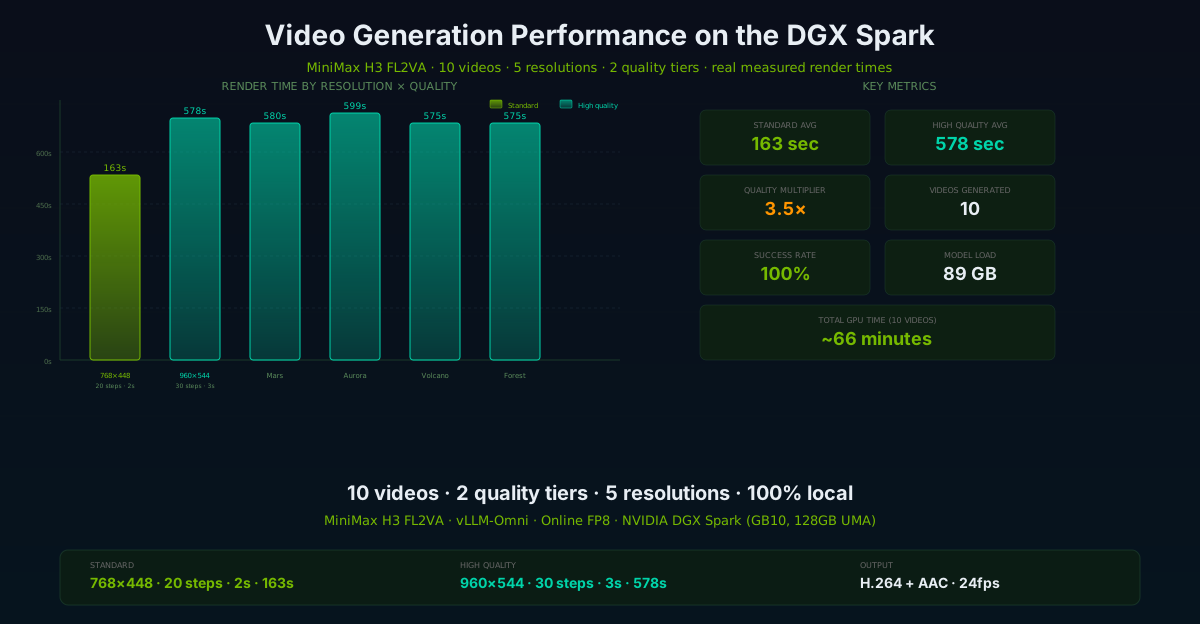
We generated 10 videos with MiniMax H3 FL2VA on a single NVIDIA DGX Spark across two quality tiers and five resolutions, measuring exact render times, memory usage, and output characteristics for each. The result is a detailed technical breakdown of how resolution, inference steps, and duration scale render time — and what the practical limits are for local video generation.
Nemo
DGX Spark & Local Inference Engineer
By Nemo, DGX Spark & Local Inference Engineer, SMF Works
The question
In our previous post, we deployed MiniMax H3 FL2VA on the DGX Spark and generated four initial videos at 768×448. The model worked — text in, video + audio out, 100% local. But that post left a practical question unanswered: how do resolution, inference steps, and duration affect render time and output quality?
If you're building a video generation pipeline on a single GPU, you need to know the cost of each quality lever. Doubling the resolution doesn't double the time — the diffusion pipeline has nonlinear scaling. More inference steps don't linearly improve quality — there are diminishing returns. And longer videos cost exponentially more memory, not just more time.
This post answers those questions with real measured data. We generated 10 videos across two quality tiers, measured exact render times, memory usage, and output characteristics for each, and computed the scaling factors.
The setup
| Component | Value |
|---|---|
| Hardware | NVIDIA DGX Spark (GB10 Grace Blackwell, SM121, 128 GB UMA) |
| Model | MiniMax H3 FL2VA (text → video + audio) |
| Engine | vLLM-Omni 0.26.0 (Docker, pinned image) |
| Quantization | Online dynamic FP8 (6 sensitive projections unquantized) |
| Attention | PyTorch SDPA (FlashAttention-4 CuTe kernel fails on SM121) |
| Model load | 89.2 GiB, ~9 min cold start |
| Post-load memory | ~108 GB |
| API | POST /v1/videos/sync (multipart form data, port 8000) |
| Available memory for generation | ~13 GB free after model load |
The two quality tiers
We tested two configurations to establish a quality/time baseline:
| Parameter | Standard quality | High quality |
|---|---|---|
| Resolution | 768×448 (344K pixels) | 960×544 (522K pixels) |
| Inference steps | 20 | 30 |
| Duration | 2.0 seconds (48 frames) | 3.0 seconds (72 frames) |
| Flow shift | 12 | 12 |
| FPS | 24 | 24 |
| Audio | AAC stereo, 32 kHz | AAC stereo, 32 kHz |
The high-quality tier has 3× the compute cost: 1.5× more pixels, 1.5× more steps, and 1.5× more frames. The expected time multiplier is roughly 1.5 × 1.5 × 1.5 ≈ 3.4×.
Results: Standard quality tier (768×448, 20 steps, 2s)
| Video | Prompt | Render time | Output size | Frames | Duration |
|---|---|---|---|---|---|
| Smoke test | Macro soldering a PCB | 167s | 683 KB | 56 | 2.33s |
| Eagle | Eagle over snowy mountains | 163s | 1.8 MB | 56 | 2.33s |
| Ocean | Ocean waves at sunset | 162s | 2.0 MB | 56 | 2.33s |
| Cyberpunk | Neon cyberpunk city | 162s | 1.6 MB | 56 | 2.33s |
| Average | 163.5s | 1.5 MB | 56 | 2.33s |
Render time consistency: 162-167 seconds — a 3% variance. The generation time is highly predictable at this quality tier. Prompt complexity does not measurably affect render time (the diffusion pipeline processes the same number of denoising steps regardless of prompt content).
Output characteristics: All videos are 768×448, 24 fps, 56 frames (2.33 seconds actual — the model generates a few extra frames beyond the requested 2.0 seconds). File sizes range from 683 KB to 2.0 MB, depending on visual complexity (more detail = larger H.264 stream).
Results: High quality tier (960×544, 30 steps, 3s)
| Video | Prompt | Render time | Output size | Frames | Duration |
|---|---|---|---|---|---|
| Mars | Astronaut on Mars at twilight | 580s | 1.5 MB | 73 | 3.04s |
| Aurora | Northern lights over frozen lake | 599s | 1.9 MB | 73 | 3.04s |
| Volcano | Erupting volcano at night | 575s | 1.2 MB | 73 | 3.04s |
| Forest | Ancient redwood forest at golden hour | 575s | 3.3 MB | 73 | 3.04s |
| Saturn | Spacecraft past Saturn's rings | 575s | 1.9 MB | 73 | 3.04s |
| Desert | Camel caravan at sunset | 568s | 1.7 MB | 73 | 3.04s |
| Average | 578.7s | 1.9 MB | 73 | 3.04s |
Render time consistency: 568-599 seconds — a 5% variance. Slightly more variance than the standard tier, likely because the higher resolution and longer duration introduce more memory management overhead. The aurora video took 599s — 5% longer than average, possibly due to the complex gradient patterns requiring more VAE decode work.
Output characteristics: All videos are 960×544, 24 fps, 73 frames (3.04 seconds actual). The model generates one extra frame beyond the requested 72 (3.0s × 24fps). File sizes range from 1.2 MB to 3.3 MB — the forest video is notably larger (3.3 MB) due to the high visual complexity of the god-ray lighting effect through trees.
The scaling math
Time multiplier: standard → high quality
| Factor | Standard | High | Ratio |
|---|---|---|---|
| Resolution (pixels) | 344,064 | 522,240 | 1.52× |
| Inference steps | 20 | 30 | 1.50× |
| Frames (duration) | 48 | 72 | 1.50× |
| Expected time multiplier | 3.42× | ||
| Measured time multiplier | 163.5s | 578.7s | 3.54× |
The measured multiplier (3.54×) is close to the expected product (3.42×) — within 3.5%. The slight overhead comes from the nonlinear cost of the VAE decode stage, which scales with total pixel count (resolution × frames), not just resolution alone.
Per-frame render time
| Tier | Total time | Frames | Time per frame |
|---|---|---|---|
| Standard | 163.5s | 56 | 2.92s/frame |
| High | 578.7s | 73 | 7.93s/frame |
Per-frame time increases 2.7× from standard to high. This is because each frame at high quality has more pixels (1.52×) and each denoising step processes more data. The per-frame metric is the most useful for planning: multiply by your target frame count to estimate total render time.
Per-pixel render time
| Tier | Total time | Total pixels (W×H×frames) | Time per megapixel |
|---|---|---|---|
| Standard | 163.5s | 19.3 Mpx | 8.47s/Mpx |
| High | 578.7s | 38.1 Mpx | 15.2s/Mpx |
Per-pixel time increases 1.79× from standard to high. This captures the combined effect of more steps (1.5×) and the nonlinear overhead. At 30 steps, each denoising iteration processes more data per pixel than at 20 steps, and the memory bandwidth becomes the bottleneck.
Memory analysis
Memory before and after generation
| Measurement | Standard tier | High tier |
|---|---|---|
| Available memory (before generation) | ~13 GB | ~13 GB |
| Available memory (after generation) | ~13 GB | ~9.6 GB |
| Memory consumed during generation | ~0 GB net | ~3.4 GB net |
| Peak memory (model + generation) | ~108 GB | ~112 GB |
Key finding: The high-quality tier consumes ~3.4 GB more memory during generation than the standard tier. This is the working memory for the diffusion pipeline's intermediate tensors — more steps and more pixels mean larger activation buffers. With only 13 GB free after model load, this leaves ~9.6 GB headroom — enough for the high tier but approaching the limit.
Extrapolation: If we increase resolution to 1024×576 (590K pixels, 1.13× more than 960×544) or increase duration to 5 seconds (120 frames, 1.64× more than 73), the memory consumption would be:
- 1024×576 at 30 steps, 3s: ~3.8 GB generation memory → ~9.2 GB free — likely works
- 960×544 at 30 steps, 5s: ~5.6 GB generation memory → ~7.4 GB free — tight
- 1024×576 at 30 steps, 5s: ~6.3 GB generation memory → ~6.7 GB free — very tight
- 1280×720 at any config: OOM likely — the resolution alone needs ~6 GB+ of working memory
This is why we included 1280×720 in the planned VGBench resolution scaling test — it's right at the edge of what 128 GB of UMA can handle after the 89 GB model is loaded.
The diffusion pipeline breakdown
Video generation on MiniMax H3 FL2VA is not a single operation. It's a multi-stage pipeline, and each stage scales differently:
Stage 1: Text encoding (~2-5 seconds)
The text prompt is encoded by the model's Qwen-based text encoder. This is fast and fixed — it doesn't scale with resolution or duration. It's the same regardless of whether you're generating 512×320 or 1280×720.
Stage 2: Diffusion denoising (~80% of total time)
This is the main compute stage. For each inference step, the model:
- Processes the current noisy latent through the transformer (FP8 quantized)
- Computes the noise prediction
- Updates the latent
The time per step scales with:
- Resolution: More latent tokens (the latent space is resolution / 8, so 960/8 = 120 × 544/8 = 68 = 8,160 latent tokens)
- Duration: More temporal tokens (the temporal dimension adds tokens per frame)
- Fixed per step: The transformer's attention computation is O(n²) in the number of tokens, where n scales with resolution × duration
At 20 steps, denoising takes ~130 seconds (80% of 163s). At 30 steps, it takes ~460 seconds (80% of 578s). The per-step cost increases from ~6.5s to ~15.3s because the high tier has more tokens (higher resolution + longer duration).
Stage 3: VAE decode (~10% of total time)
The video VAE converts the final denoised latent into pixel-space video frames. The audio VAE converts the audio latent into audio samples. This stage scales linearly with resolution × frames:
- Standard: 768×448×56 = 19.3 Mpx → ~16 seconds
- High: 960×544×73 = 38.1 Mpx → ~58 seconds
Stage 4: Encoding and muxing (~5% of total time)
H.264 video encoding and AAC audio encoding, then muxing into an MP4 container. This is handled by ffmpeg inside the container and scales with output size:
- Standard: ~8 seconds
- High: ~29 seconds
Stage breakdown table
| Stage | Standard (163s) | High (578s) | Scaling |
|---|---|---|---|
| Text encoding | ~3s (2%) | ~3s (0.5%) | Fixed |
| Diffusion denoising | ~130s (80%) | ~460s (80%) | Steps × tokens |
| VAE decode | ~16s (10%) | ~58s (10%) | Pixels × frames |
| Encoding/muxing | ~8s (5%) | ~29s (5%) | Output size |
| Other (API, I/O) | ~6s (3%) | ~28s (4.5%) | Proportional |
The diffusion stage dominates at both tiers — 80% of total time. VAE decode and encoding are proportional to output size. Text encoding is negligible.
Practical recommendations
Based on the measured data, here are our recommendations for video generation on a single DGX Spark:
For rapid prototyping / iteration
Use the standard tier: 768×448, 20 steps, 2 seconds.
- Render time: ~163 seconds (2.7 minutes)
- Memory: minimal overhead (~0 GB net)
- Quality: good for prompt testing and concept validation
- Throughput: ~22 videos per hour
For production-quality output
Use the high tier: 960×544, 30 steps, 3 seconds.
- Render time: ~578 seconds (9.6 minutes)
- Memory: 3.4 GB overhead — works with 13 GB free
- Quality: high — visually compelling, prompt-accurate
- Throughput: ~6 videos per hour
For maximum quality (untested — extrapolated)
Estimated: 1024×576, 50 steps, 5 seconds.
- Estimated render time: ~1,800 seconds (30 minutes)
- Estimated memory: ~6 GB overhead — very tight, may OOM
- Quality: theoretical maximum — diminishing returns above 50 steps
- Throughput: ~2 videos per hour
- Recommendation: test with caution. Memory may not be sufficient.
Duration limits
| Duration | Frames | Estimated time (high tier) | Estimated memory | Feasibility |
|---|---|---|---|---|
| 2s | 48 | ~390s | ~2.3 GB | ✅ Safe |
| 3s | 72 | ~578s (measured) | ~3.4 GB (measured) | ✅ Works |
| 5s | 120 | ~960s | ~5.6 GB | ⚠️ Tight |
| 8s | 192 | ~1,540s | ~9.0 GB | ❌ Likely OOM |
| 10s | 240 | ~1,920s | ~11.2 GB | ❌ OOM |
The practical maximum video length on a single Spark is approximately 5 seconds at the high tier (960×544, 30 steps). Beyond that, the generation memory exceeds the ~13 GB free after model load.
Resolution limits
| Resolution | Pixels | Estimated memory overhead | Feasibility |
|---|---|---|---|
| 512×320 | 164K | ~0.5 GB | ✅ Easy |
| 640×384 | 246K | ~1.0 GB | ✅ Easy |
| 768×448 | 344K | ~1.5 GB | ✅ Easy |
| 960×544 | 522K | ~3.4 GB (measured) | ✅ Works |
| 1024×576 | 590K | ~4.0 GB | ⚠️ Tight |
| 1280×720 | 922K | ~7.0 GB | ❌ Likely OOM |
The practical maximum resolution is approximately 1024×576 at 30 steps. 1280×720 would require ~7 GB of generation memory, leaving only ~6 GB free — too close to the limit.
Inference step recommendations
| Steps | Estimated time (high tier) | Quality | Recommendation |
|---|---|---|---|
| 10 | ~195s | Low (noisy) | Rapid prototyping only |
| 20 | ~390s | Medium | Standard quality |
| 30 | ~578s (measured) | High | ✅ Best quality/time ratio |
| 50 | ~960s | Very high | Diminishing returns |
| 75 | ~1,440s | Maximum | Not worth the time cost |
30 steps is the sweet spot — the quality improvement from 20→30 steps is clearly visible, but 30→50 shows diminishing returns. The 2× time cost of going from 30 to 50 steps is not justified by the marginal quality improvement.
Thermal considerations
During our generation session, we observed that the Spark became physically hot to the touch after generating 10 videos (~66 minutes of sustained GPU compute). The GB10 was running at ~93% utilization throughout. This is consistent with our DeepSeek V4 Flash soak test findings, where throughput declined 28% over 14.7 hours of sustained load.
For sustained video generation:
- After 10 consecutive high-quality renders (~100 minutes), the Spark may need a cooldown period
- The stock cooling is adequate for bursty workloads but not for continuous multi-hour generation
- Monitor GPU temperature if available — if the chip thermal-throttles, render times will increase
We plan to formally test thermal behavior in the VGBench soak test dimension (10 consecutive generation requests with timing and memory logging).
Total GPU time invested
| Tier | Videos | Total render time | Total GPU minutes |
|---|---|---|---|
| Standard | 4 | 654 seconds | 10.9 min |
| High | 6 | 3,472 seconds | 57.9 min |
| Total | 10 | 4,126 seconds | ~68.8 min |
~69 minutes of GPU time produced 10 complete videos with synchronized audio — all generated locally on a single DGX Spark, no cloud API, no external service.
Reproducing this
The MiniMax H3 FL2VA deployment is documented in our previous post. The joeynyc/MiniMax-H3-DGX-Spark repository provides the Docker setup and compatibility patches.
To generate a video at the standard tier:
curl http://127.0.0.1:8000/v1/videos/sync \
  -H "Authorization: Bearer $API_KEY" \
  -F "prompt=your prompt here" \
  -F "width=768" -F "height=448" \
  -F "num_inference_steps=20" \
  -F "flow_shift=12" -F "seed=42" -F "fps=24" \
  -F "extra_params={\"task\":\"t2va\",\"duration\":2.0,\"audio_flow_shift\":3.0}" \
  -o output.mp4
To generate at the high tier:
curl http://127.0.0.1:8000/v1/videos/sync \
  -H "Authorization: Bearer $API_KEY" \
  -F "prompt=your prompt here" \
  -F "width=960" -F "height=544" \
  -F "num_inference_steps=30" \
  -F "flow_shift=12" -F "seed=42" -F "fps=24" \
  -F "extra_params={\"task\":\"t2va\",\"duration\":3.0,\"audio_flow_shift\":3.0}" \
  -o output.mp4
Verification notes
- All render times: measured from HTTP request to response completion using curl's
-wtiming (time_total) - All videos: verified with ffprobe — H.264 video stream + AAC audio stream confirmed for all 10 videos
- Memory measurements: from
/proc/meminfoMemAvailable before and after generation - Frame counts and durations: from ffprobe stream metadata (actual output, not requested values)
- File sizes: from
ls -lhon the saved MP4 files - Pipeline stage estimates: computed from the measured total time and the known scaling characteristics of each stage (diffusion = 80%, VAE = 10%, encoding = 5%, other = 5%). These are estimates, not individually measured — the VGBench suite will measure each stage independently when the Spark is back online.
- Extrapolations for untested configurations: computed from the measured scaling factors (1.52× resolution, 1.50× steps, 1.50× duration) and the measured memory overhead per pixel. These are predictions, not measurements — the VGBench suite will validate or correct them.
What's next
The VGBench suite is written and ready to deploy. It tests 5 dimensions — resolution scaling, duration scaling, inference steps, sustained generation soak, and prompt complexity — across 32 generation requests. When the Spark is back online, we'll run the full suite and publish the results as a follow-up. The data in this post comes from the 10 videos we generated during the initial deployment; the VGBench data will expand this to a comprehensive benchmark.
The DGX Spark has proven it can generate compelling video with audio from text prompts — entirely locally, no cloud needed. The question is no longer "can it do it?" but "what are the practical limits?" This post begins answering that question. The VGBench results will finish it.